At least with regard to significant wave height (rather, describing the sea conditions):
It's more useful to describe a "sea state" which is made up of infinitely many frequencies, directions, etc. than to have a timeseries of wave elevation at a given point. A snapshot of the overall sea conditions for a given time, if you will.
Sea states can be well described by a couple statistical parameters, namely significant wave height (Hs), peak wave period (Tp), and peak wave direction. There are other refining parameters such as the directional spread but Hs, Tp, and direction are quite informative.
The hourly one is cleaner and more readable only because they've insisted on using a symbol for each datum which obscures the line itself... I'd like this one 6 times more than the original, otherwise.
Personally, I don't understand why anyone would want to look at timeseries data with anything less than the maximum possible information density & precision (accuracy is not the problem). Maybe if you're looking for cleanliness/aesthetic reasons, but that's not really the point of these charts. Obviously if they are noisy something needs to be done. But binning only really makes sense to me in histograms, not timeseries.
I don't see why binning would be advantageous here. If it's noisy, apply a moving average. But binning it is just throwing (time) data away. Don't get me wrong, I think it's great we have access to this data at all. Just curious why it's not higher-resolution.
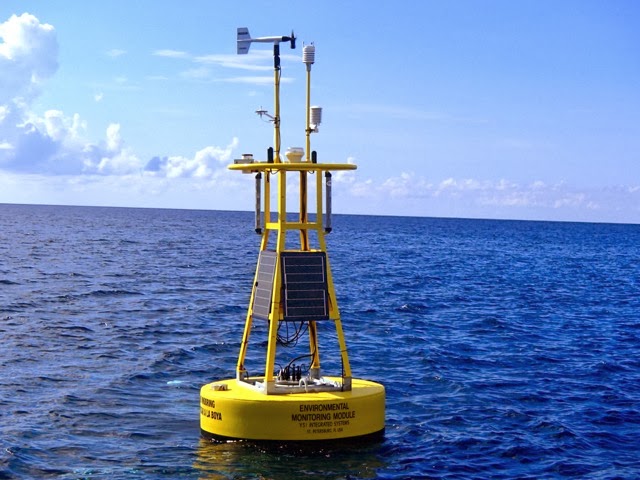
It could be power restraints -- the buoy is almost certainly solar powered and may not have enough reserve/design capacity to transmit at high resolutions over multiple days without sunlight.
Or it may have just been designed that way -- perhaps the cost of the necessary equipment to transmit/log at higher frequencies didn't justify the benefit. Perhaps once per hour is sufficient for the purposes the buoy was deployed for.
Looks like at most 50 watt solar panels, probably closer to 25 watts. It probably has 4 of them but only 2 can make any appreciable amount of power at a time. Not much power at all considering the instrumentation and lighting load(I believe most are lit at night for collision avoidance) and that it has to power the buoy and recharge the batteries during the day.
I considered why they wouldn't put larger panels/batteries -- cost, which, compared to what I would think is the overall cost, would be minimal.
Wind loading is another story -- It looks fairly streamlined. Larger panels would significantly increase the wind load, and they already have a fair bit of trouble keeping them attached in storms(though more likely due to the waves).
I have experience working with directional waverider buoys, and ultimately what is useful to me is a statistical representation of sea conditions for a given period (typically 3 hours). I could obtain the raw timeseries of accelerations from the buoy but this is really much less interesting than the rolling spectral statistics that are processed by and output by the buoy.
Then use a 3-hour moving average of the timeseries... This does not imply one data point per 3 hours, the rolling average timeseries interval can be (& generally is) far more granular than the window size of the average.
To comment on the other measurements (temp, pressure, wind spd/dir): these are different from Hs in that Hs is by definition a statistical parameter; it is 4*stdev of the wave elevations or more practically the mean of the highest third of measured wave heights. You could have higher granularity of temperature, pressure, etc. which arguably more precisely tells you about those conditions at a given time, but a more granular time series of Hs does not necessarily define the sea state any better.
I think you're not understanding me, or I'm not understanding you...unless for some specific reason you want to know a wave elevation timeseries (which given the question "how do I describe the current sea conditons" you probably don't; also, noting that significant wave height is not the same as wave elevation), the statistical parameters which are derived from the timeseries data are more useful. These of course can be given on a rolling basis.